Accounting
Anthropology
Archaeology
Art History
Banking
Biology & Life Science
Business
Business Communication
Business Development
Business Ethics
Business Law
Chemistry
Communication
Computer Science
Counseling
Criminal Law
Curriculum & Instruction
Design
Earth Science
Economic
Education
Engineering
Finance
History & Theory
Humanities
Human Resource
International Business
Investments & Securities
Journalism
Law
Management
Marketing
Medicine
Medicine & Health Science
Nursing
Philosophy
Physic
Psychology
Real Estate
Science
Social Science
Sociology
Special Education
Speech
Visual Arts
Question
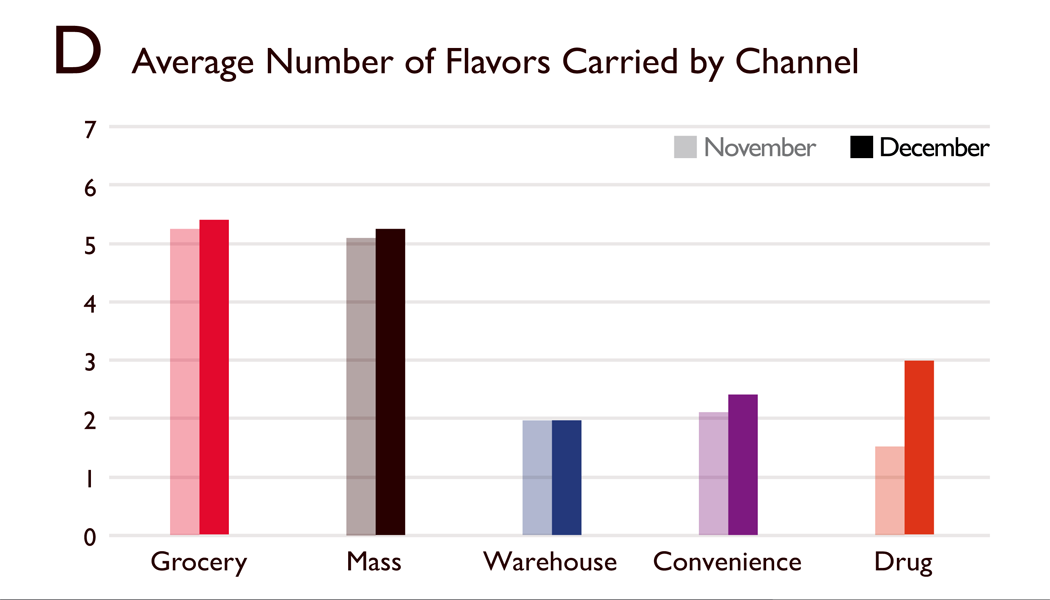
Figure 1.: General Mills Marketing Dashboard Chart "D"
Consider Figure 1.: General Mills Marketing Dashboard Chart "D" above. As part of the Warm Delights team at General Mills, you are asked to analyze and interpret the marketing dashboard for Warm Delights Minis. After a careful analysis of Chart "D," you are especially interested in major changes from November to December. As a result, you would look most carefully at
a. the total amount spent on Warm Delights (regular) by customers in November and December.
b. the preference of Warm Delights Minis over Warm Delights (regular).
c. the distribution channel preferences of customers.
d. the level of analysis for sales results for the total sales Warm Delights.
e. the differences in the numbers of Warm Delights Minis flavors carried by different outlets for November and December.
Answer
This answer is hidden. It contains 153 characters.
Related questions
Q:
Which of the following statements regarding corporate vertical marketing systems is most accurate?
a. Corporate vertical marketing systems can use either forward integration or backward integration but not both.
b. Corporate vertical marketing systems increase distribution costs.
c. Corporate vertical marketing systems increase investment but decrease fixed costs.
d. Corporate vertical marketing systems are only effective with low-end consumer products.
e. Corporate vertical marketing systems combine successive stages of production and distribution under a single ownership.
Q:
The three major types of vertical marketing systems are administered, corporate, and __________.
a. integrated
b. cooperative
c. delegated
d. manufacturer-dominated
e. contractual
Q:
Which type of marketing channel arrangement is especially good for a firm to use in global marketing where the creation of marketing channel relationships is expensive and time consuming?
a. dual distribution
b. cooperative distribution
c. strategic channel alliance
d. global distribution alliance
e. multichannel distribution
Q:
Strategic channel alliances refer to
a. an arrangement whereby a firm reaches different buyers by employing two or more different types of channels for the same basic product.
b. a practice whereby one firm's marketing channel is used to sell another firm's products.
c. the blending of different communication and delivery channels that are mutually reinforcing in attracting, retaining, and building relationships with consumers who shop and buy in traditional intermediaries and online.
d. an arrangement whereby companies reduce distribution costs by sharing facilities, equipment, and transportation.
e. a practice whereby consumers can interact with various advertising media to buy products without a face-to-face meeting with a salesperson.
Q:
Reductions in unit costs for a larger order are referred to as
a. promotional allowances.
b. quantity discounts.
c. economic order discounts.
d. penetration pricing.
e. case allowances.
Q:
It is relatively easy to measure the incremental cost of a new advertising campaign; what is not as easy is
a. measuring the extra fixed cost involved.
b. measuring the extra variable cost involved.
c. measuring the incremental revenue generated by the new advertising campaign.
d. determining whether customers who stop buying the product are reacting negatively to the advertisement or to some other aspect of the product itself.
e. determining what percentage of the ad-generated revenue should be reinvested into additional advertisements of the same form.
Q:
A price war refers to
a. competition between sellers and resellers to maintain or attain the largest market share of potential customers.
b. conflicts between manufacturers and distributors regarding acceptable percentages they each may charge relative to one another.
c. when one channel member believes another channel member is engaged in pricing behavior that prevents it from achieving its profitability goals.
d. the successive price cutting by competitors to increase or maintain their unit sales or market share.
e. the practice of replacing promotional allowances with lower manufacturer list prices.
Q:
Tostitos Photo
Consider the Tostitos products photo above. Frito-Lay recognizes that its tortilla chip products are partial substitutes for one another. The company's bean and cheese dips and salsa sauces complement its tortilla chips. Frito-Lay uses this knowledge to set prices for each item, which is known as
a. bundle pricing.
b. price lining.
c. customary pricing.
d. product-line pricing.
e. loss-leader pricing.
Q:
The price for Nintendo's Wii video game console was likely insufficient to cover its fixed and variable costs. However, the price of its video games was set high enough to cover the video game console loss and deliver a handsome profit for the entire Nintendo product line. This example illustrates Nintendo's use of
a. bundle pricing.
b. product-line pricing.
c. price lining.
d. customary pricing.
e. loss-leader pricing.
Q:
When establishing product line pricing, the highest priced item is typically positioned as
a. the oldest product item in the line.
b. the best-selling product item in the line.
c. the premium item in terms of quality and features.
d. the loss leader item for the rest of the product line.
e. the most price insensitive product item in the line.
Q:
Product-line pricing refers to
a. setting the price of a line of products at a number of different specific pricing points.
b. deliberately selling a product below its customary price, not to increase sales, but to attract customers' attention in hopes that they will buy other products as well.
c. adding a fixed percentage to the cost of all items in a specific product class.
d. setting of prices for all items in a product line to cover the total cost and produce a profit for the complete line, not necessarily for each item.
e. the marketing of two or more products in a single package.
Q:
What do 60 percent of prospective buyers dread about looking for a new car?
a. selecting the preferred brand
b. negotiating the price
c. taking a test drive
d. experiencing postpurchase dissonance
e. searching for cars on the Internet
Q:
Yield management pricing is a form of
a. target pricing.
b. loss-leader pricing.
c. dynamic pricing.
d. customary pricing.
e. price lining.
Q:
The American Marketing Association Statement of Ethics is centered on three general norms: marketers must: (1) do no harm; (2) foster trust in the marketing system; and (3) __________.
a. initiate fair and honest dialogues in developing markets
b. embrace, communicate, and practice the fundamental ethical values that will improve consumer confidence in the integrity of the marketing exchange system
c. champion new legislation that protects ethical business firms and punish those who abuse consumer trust
d. support governmental agencies in their quest to identify and prosecute those who break the laws of ethical marketing
e. contribute to society's well-being through charitable contributions and cause-related marketing efforts
Q:
In 2001, six executives of Tyson Foods, one of the world's largest poultry, beef, and pork processors, were arrested for the illegal smuggling of undocumented foreign workers into the U.S. to work at Tyson plants. Based on this information, one could conclude that Tyson's violations are the result of __________, one of the major reasons why some company employees engage in ethical behavior.
a. a mission statement that is too broad
b. the absence of a written core values statement
c. the absence of whistle-blowers
d. top management's behavior
e. the absence of a stakeholder code of ethics
Q:
All of the following are addressed by an organization's code of ethics EXCEPT:
a. the dress, sayings, and work manner of employees.
b. contributions to political parties and government officials.
c. customer and supplier relationships.
d. accurate recordkeeping.
e. conflicts of interest.
Q:
A code of ethics is a formal statement of rules of conduct and
a. legal restrictions.
b. moral laws.
c. ethical principles.
d. core values.
e. cultural values.
Q:
The set of values, ideas, and attitudes that is learned and shared among the members of an organization is referred to as __________.
a. a mission statement
b. core values
c. the socialization process
d. a code of ethics and conduct
e. corporate culture
Q:
Transparency International is an organization that
a. monitors how developed nations deal with developing nations.
b. establishes procedures for ethical international business based on the ISO 7000 Code of Conduct.
c. monitors and ranks nations worldwide according to their perceived use of bribery.
d. creates an acceptable international code of ethics.
e. makes sure federal, state, and local governments in the United States abide by the Consumer Bill of Rights.
Q:
Bribery is most likely to occur when
a. industries experience little competition.
b. the country has reached a high level of economic development.
c. industries are high-tech in nature.
d. industries operate in an oligarchic competitive environment.
e. industries experience intense competition.
Q:
Economic espionage includes such activities as _________.
a. two firms hiring the same musician to write their company jingle
b. hiring people who ever worked in an executive capacity at a competitor's firm, especially if they didn"t have a noncompete clause
c. offering to accept all competitors' coupons, making their effectiveness as a promotional tool negligible
d. searching through a competitor's trash
e. marrying someone who works for a competitor in an executive position
Q:
Recently, certain toys that were manufactured in China were found to have unsafe levels of lead in the paint and were recalled. This action protected consumers' right to
a. safety.
b. be informed.
c. be heard.
d. choose.
e. be treated courteously.
Q:
Recently, a project team for Cosco, the world's largest children's products company, developed a high chair that could be used as an infant feeding seat, a youth chair, a play chair, a booster chair, and when reclined, an infant bed. Its design could be made and sold for $49. The marketing manager, in consultation with other middle managers, decided to have the prototypes checked out by Cosco employees who had small children. This was the only product testing performed on the product. Before Cosco pulled the unsafe chair from the market, several children were injured and some died as a result of using the chair. Cosco was charged with being unconcerned about consumers' right to
a. choose.
b. be informed.
c. be treated courteously.
d. safety.
e. happiness.
Q:
The right to be heard means that
a. the U.S. Department of Commerce has the right to hear consumer complaints.
b. the American Marketing Association has the right to discipline marketers based on customer complaints.
c. consumers should have access to public policy makers regarding complaints about products and services.
d. companies should have access to public policy makers regarding complaints about fraudulent consumer practices.
e. consumers should have access to public policy makers regarding new product ideas.
Q:
In 1962, President John F. Kennedy outlined a Consumer Bill of Rights that codified the ethics of exchange between buyers and sellers. These were the right: (1) to safety; (2) to be informed; (3) __________; and (4) to be heard.
a. to have legal representation in a court of law
b. to exchange or return products within a reasonable period of time
c. to choose
d. to demand "rain checks" if advertised goods are out of stock
e. to be compensated for product defects
Q:
The Consumer Bill of Rights codified the ethics of exchange between buyers and sellers. It was outlined by __________ in __________.
a. President John Kennedy; 1962.
b. President Ronald Reagan; 1983.
c. President William H. Clinton; 1996.
d. President George W. Bush; 2003.
e. President Barack Obama; 2009.
Q:
A law that codified the ethics of exchange between buyers and sellers, including the rights to safety, to be informed, to choose, and to be heard, is referred to as the
a. Lanham Act
b. Fair Practices Act
c. Caveat Emptor Decree
d. Consumer Bill of Rights
e. Customer Consent Decree
Q:
Caveat emptor refers to
a. The legal concept of "let the buyer beware," which was pervasive in the American business culture prior to the 1960s.
b. The marketing concept of "be first or be last," implying that the first company to the marketplace wins.
c. The Latin term meaning that "all is fair in love and war," an attitude that was held by most marketers prior to the 1990s.
d. The legal concept of "such is life," which created many illegal as well as legal but unethical business practices during the 1980s.
e. The Latin phrase meaning "empty promises," which was a charge placed upon many firms during the period after WWII when products failed to meet their marketing claims.
Q:
The legal concept of "let the buyer beware," which was pervasive in the American business culture prior to the 1960s, is referred to as __________.
a. ad nauseum
b. mea culpa
c. quid pro quo
d. cest la vie
e. caveat emptor
Q:
In marketing, the set of values, ideas, and attitudes that are learned and shared among members of a group is referred to as __________.
a. ideals
b. morals
c. ethics
d. culture
e. diversity